 ekke
da6f968725
ekke
da6f968725
Excel export (from TWG feedback)
- src/analysis/xlsx.js: a dependency-free XLSX writer — an .xlsx is a ZIP of
  XML, so this packs the required parts with a small stored-ZIP writer. Avoids
  SheetJS (stale npm package with advisories) and ExcelJS (heavy for an
  offline-first field app), and does not rely on the JSZip that only reaches us
  transitively via shp-write. Lazy-loaded as a ~5.6 kB chunk.
- After a zonal run the Analysis panel offers "Export table (Excel)", writing a
  two-sheet workbook: Results (figures as real numbers) and Parameters (zone
  and input layers with feature counts, the "Apply to" scope, membership rule,
  statistics, numeric field and export time) — so a table can be verified or
  reproduced later rather than being an unattributed set of numbers.
  The button is hidden for overlay runs and cleared when the mode changes.
- Verified against two independent readers: openpyxl loads it with zero
  warnings and correct numeric types, and LibreOffice Calc opens it as a
  spreadsheet. Also exercised end-to-end through the real zonal pipeline.

COG raster entry point
- Add External Layer gains a COG type alongside WMS/WFS/XYZ, with a URL
  pre-flight check that distinguishes a web page, a 404, a CORS block and a
  server without byte-range support — geotiff.js otherwise reports these only
  as an opaque "AggregateError: Request failed".

Digital Earth Africa ETL
- etl/deafrica_dem_to_minio.py exports a DE Africa DEM for a district as a COG
  and uploads it to the LUSPA MinIO bucket raster-objects, then verifies the
  object is anonymously readable and range-capable. Credentials come from the
  environment; the existing PHP integration hardcodes them and an earlier key
  pair reached Gitea. NOTE: not yet run against the Sandbox — start with
  --list-products to confirm the DEM product name.

Documents
- Concept note: Digital Earth Africa added as a raster source (§6.3), separating
  the live WMS route from the batch Sandbox export; corrected the in-house
  contour table's provenance to OpenTopography (gdal_contour over an SRTM 30 m /
  Copernicus 30 m DEM), and added the ToR §2.4.2 / FS §2 alignment chapter.
- TWG presentation, architecture and two integration workflow charts (SVG
  sources kept in the repo so they stay editable), and a user guide for the
  Analyse tools.

Service worker v13 -> v14. .gitignore: exclude Python bytecode from etl/.

Co-Authored-By: Claude Opus 4.8 <noreply@anthropic.com>
68 lines
4.2 KiB
XML
68 lines
4.2 KiB
XML

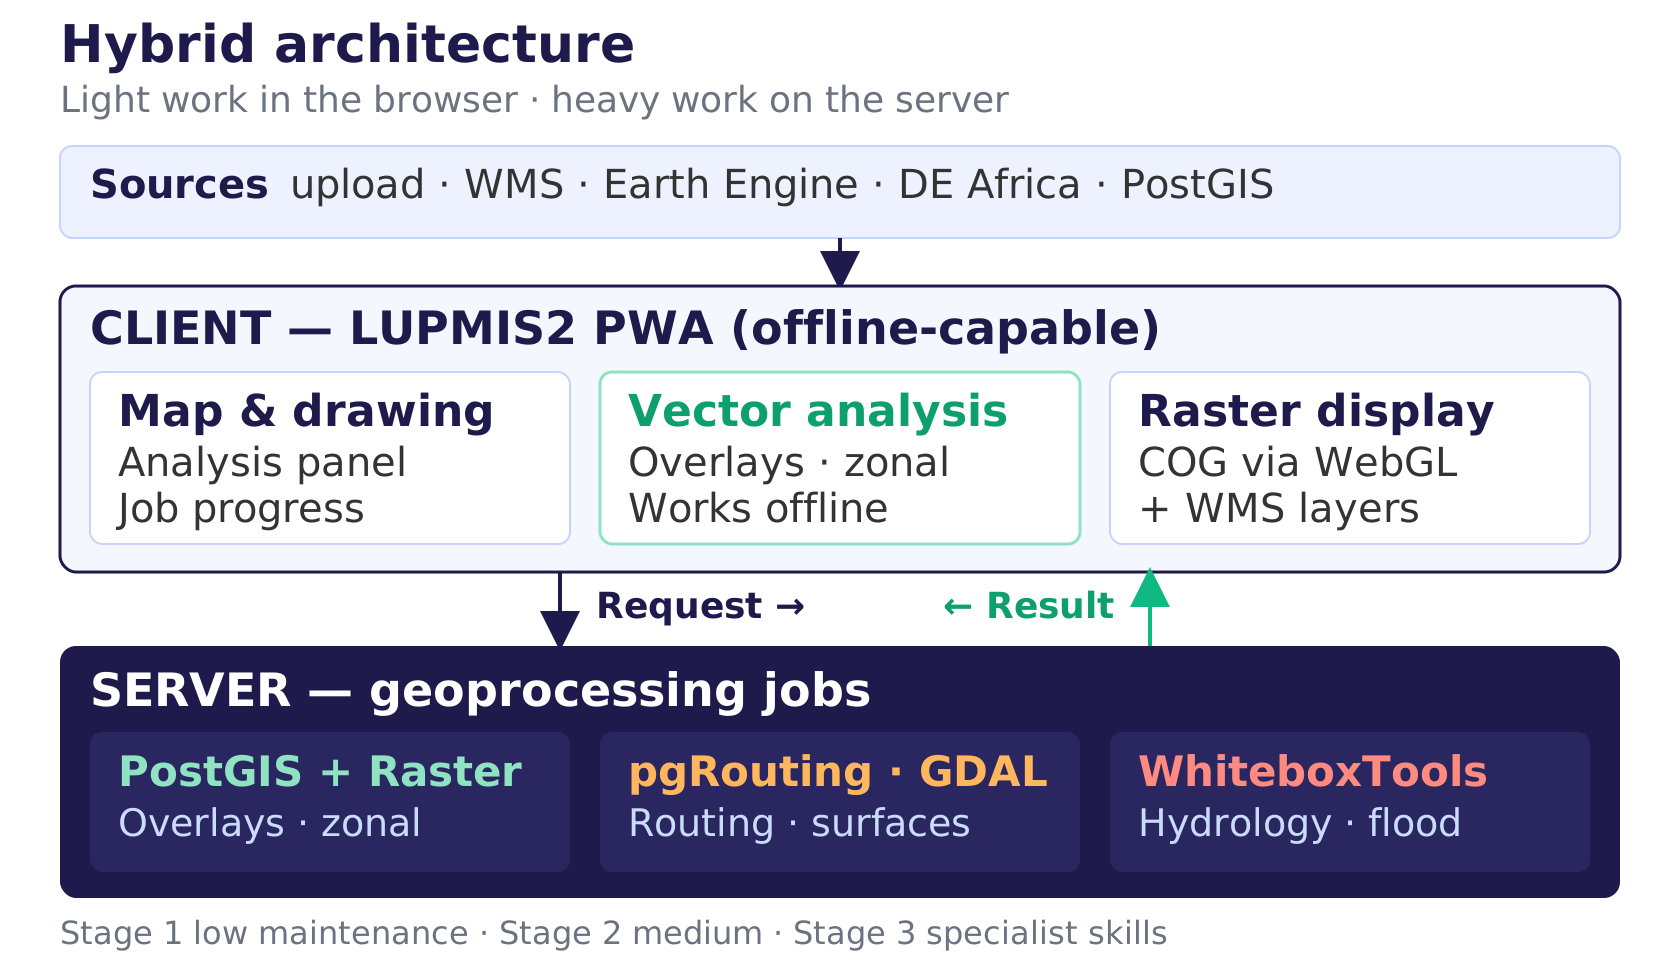


<svg xmlns="http://www.w3.org/2000/svg" width="1680" height="960" viewBox="0 0 1680 960" font-family="Calibri, Arial, sans-serif">
|
|
<!-- Figure 1 of LUPMIS2_Analytical_Tools_Concept.docx, also slide 4 of the TWG deck.
|
|
Rendered at 1680 px across ~10.6 in of slide (~158 px/in), so 44 px is about 20 pt.
|
|
Labels are deliberately short so the diagram stays legible when projected.
|
|
Re-render: rsvg-convert -w 1680 -h 960 this.svg -o out.png -->
|
|
<defs>
|
|
<marker id="arr" markerWidth="10" markerHeight="10" refX="7" refY="4" orient="auto">
|
|
<path d="M0,0 L8,4 L0,8 Z" fill="#1E1A4B"/></marker>
|
|
<marker id="arrG" markerWidth="10" markerHeight="10" refX="7" refY="4" orient="auto">
|
|
<path d="M0,0 L8,4 L0,8 Z" fill="#10B981"/></marker>
|
|
</defs>
|
|
<rect width="1680" height="960" fill="#FFFFFF"/>
|
|
|
|
<text x="60" y="62" font-size="52" font-weight="bold" fill="#1E1A4B">Hybrid architecture</text>
|
|
<text x="60" y="112" font-size="36" fill="#6B7280">Light work in the browser · heavy work on the server</text>
|
|
|
|
<!-- DATA SOURCES -->
|
|
<rect x="60" y="146" width="1560" height="92" rx="12" fill="#EEF2FF" stroke="#C7D2FE" stroke-width="2"/>
|
|
<text x="90" y="198" font-size="40" font-weight="bold" fill="#1E1A4B">Sources</text>
|
|
<text x="290" y="198" font-size="40" fill="#333333">upload · WMS · Earth Engine · DE Africa · PostGIS</text>
|
|
|
|
<line x1="840" y1="238" x2="840" y2="286" stroke="#1E1A4B" stroke-width="4" marker-end="url(#arr)"/>
|
|
|
|
<!-- CLIENT -->
|
|
<rect x="60" y="286" width="1560" height="286" rx="16" fill="#F5F7FF" stroke="#1E1A4B" stroke-width="3"/>
|
|
<text x="90" y="344" font-size="46" font-weight="bold" fill="#1E1A4B">CLIENT — LUPMIS2 PWA (offline-capable)</text>
|
|
|
|
<rect x="90" y="372" width="480" height="172" rx="12" fill="#FFFFFF" stroke="#C7D2FE" stroke-width="2"/>
|
|
<text x="118" y="426" font-size="44" font-weight="bold" fill="#1E1A4B">Map & drawing</text>
|
|
<text x="118" y="476" font-size="40" fill="#333333">Analysis panel</text>
|
|
<text x="118" y="522" font-size="40" fill="#333333">Job progress</text>
|
|
|
|
<rect x="600" y="372" width="480" height="172" rx="12" fill="#FFFFFF" stroke="#8FE3C2" stroke-width="3"/>
|
|
<text x="628" y="426" font-size="44" font-weight="bold" fill="#0E9F6E">Vector analysis</text>
|
|
<text x="628" y="476" font-size="40" fill="#333333">Overlays · zonal</text>
|
|
<text x="628" y="522" font-size="40" fill="#333333">Works offline</text>
|
|
|
|
<rect x="1110" y="372" width="480" height="172" rx="12" fill="#FFFFFF" stroke="#C7D2FE" stroke-width="2"/>
|
|
<text x="1138" y="426" font-size="44" font-weight="bold" fill="#1E1A4B">Raster display</text>
|
|
<text x="1138" y="476" font-size="40" fill="#333333">COG via WebGL</text>
|
|
<text x="1138" y="522" font-size="40" fill="#333333">+ WMS layers</text>
|
|
|
|
<!-- ARROWS -->
|
|
<line x1="560" y1="572" x2="560" y2="646" stroke="#1E1A4B" stroke-width="4" marker-end="url(#arr)"/>
|
|
<text x="596" y="618" font-size="36" font-weight="bold" fill="#1E1A4B">Request →</text>
|
|
|
|
<line x1="1150" y1="646" x2="1150" y2="572" stroke="#10B981" stroke-width="4" marker-end="url(#arrG)"/>
|
|
<text x="1114" y="618" font-size="36" font-weight="bold" fill="#0E9F6E" text-anchor="end">← Result</text>
|
|
|
|
<!-- SERVER -->
|
|
<rect x="60" y="646" width="1560" height="252" rx="16" fill="#1E1A4B"/>
|
|
<text x="90" y="706" font-size="46" font-weight="bold" fill="#FFFFFF">SERVER — geoprocessing jobs</text>
|
|
|
|
<rect x="90" y="732" width="480" height="140" rx="12" fill="#2A2660"/>
|
|
<text x="118" y="786" font-size="42" font-weight="bold" fill="#8FE3C2">PostGIS + Raster</text>
|
|
<text x="118" y="836" font-size="38" fill="#CADCFC">Overlays · zonal</text>
|
|
|
|
<rect x="600" y="732" width="480" height="140" rx="12" fill="#2A2660"/>
|
|
<text x="628" y="786" font-size="42" font-weight="bold" fill="#FFB65C">pgRouting · GDAL</text>
|
|
<text x="628" y="836" font-size="38" fill="#CADCFC">Routing · surfaces</text>
|
|
|
|
<rect x="1110" y="732" width="480" height="140" rx="12" fill="#2A2660"/>
|
|
<text x="1138" y="786" font-size="42" font-weight="bold" fill="#FF8A80">WhiteboxTools</text>
|
|
<text x="1138" y="836" font-size="38" fill="#CADCFC">Hydrology · flood</text>
|
|
|
|
<text x="60" y="944" font-size="32" fill="#6B7280">Stage 1 low maintenance · Stage 2 medium · Stage 3 specialist skills</text>
|
|
</svg>
|